


May 26 2023 - 7:15am
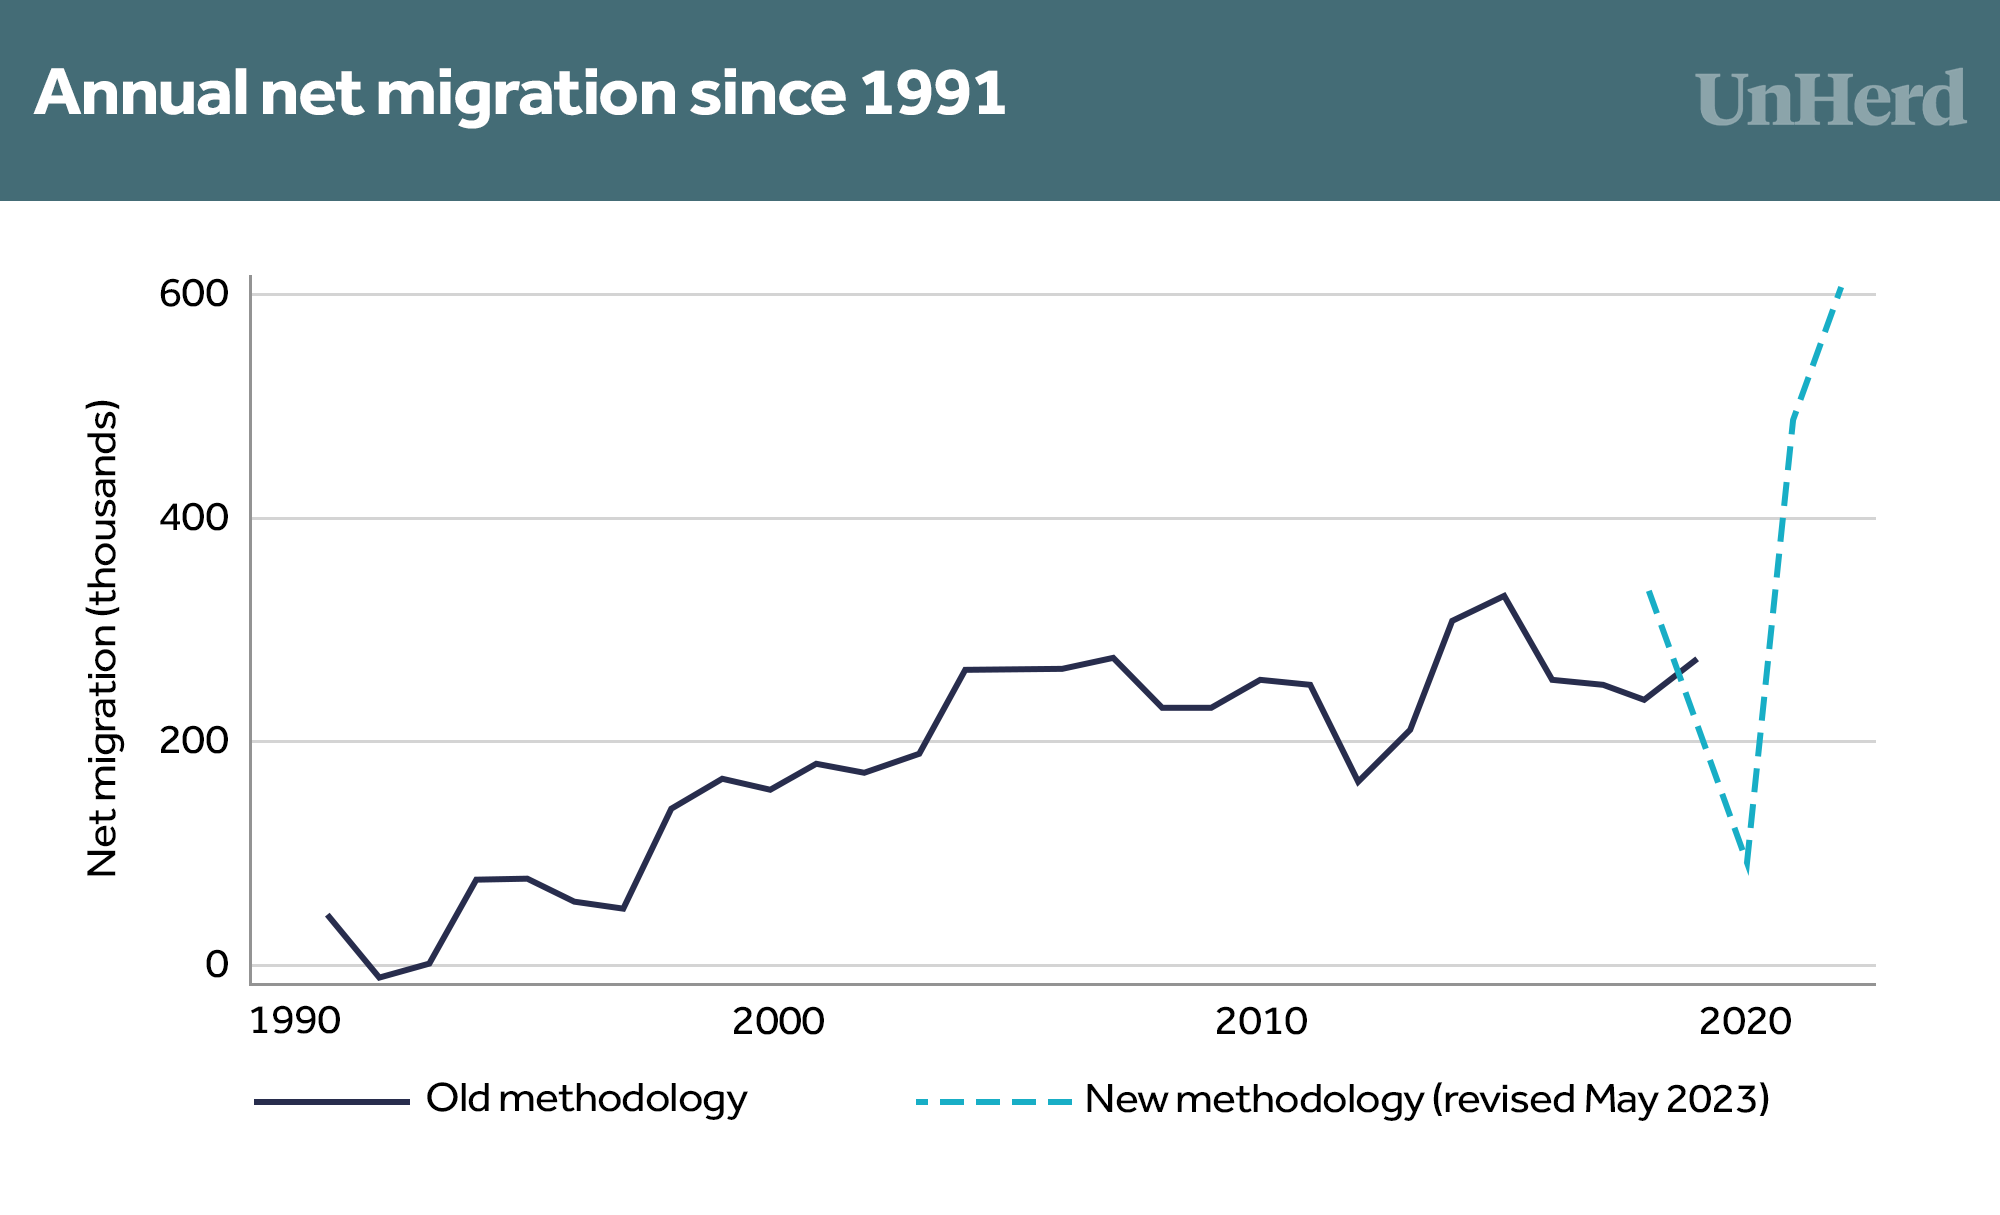
Yesterday, the Office for National Statistics published its latest estimates of long-term migration to and from the UK. Net migration for the year ending December 2022 — the figure everyone was waiting for — came in somewhat lower than expected. The Centre for Policy Studies had forecast that “net migration could hit between 700,000 and 997,000”. Yet the published figure is 606,000.
Although this is almost 100,000 less than expected, it’s still extremely high by historical standards. To see just how high, I’ve combined the ONS’s latest estimates with older data published by the House of Commons Library.
It’s important to note that the ONS’s methodology changed in 2020 and was revised again for yesterday’s release. For example, the latest estimates include asylum applications but excludes EU migrants who do not satisfy the definition of a long-term migrant. They are given by the dashed line above.
In the two years of overlap, the new methodology yielded a higher estimate in one year, while the old methodology yielded a higher estimate in the other. So while we should be cautious about comparing estimates based on different methodologies, those produced by the new methodology don’t seem to be consistently higher.
In any case, the chart indicates that net migration was substantially higher last year than in any previous year since 1991 (and last year’s figure was also a record-breaker).
To get an even longer-term perspective, I’ve combined the ONS’s latest estimates with decadal estimates going all the way back to 1901. As the House of Commons Library explains, these estimates were calculated as “the difference between two subsequent census populations that is not attributed to recorded births or deaths”.
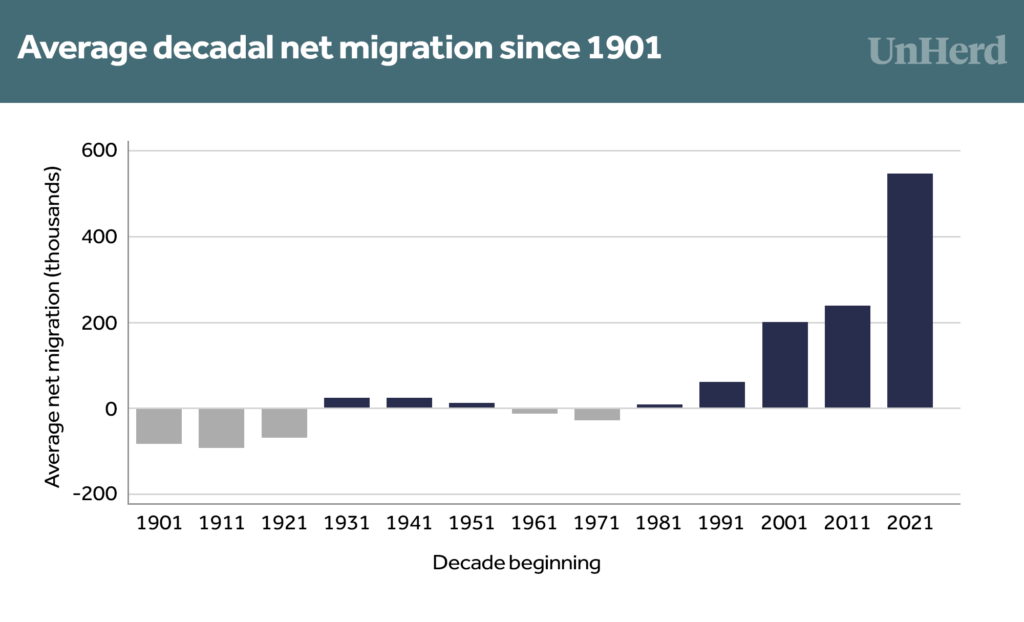
In the chart above, the bar corresponding to the decade beginning 2021 is based on only two years of data, whereas all the others are based on 10 years of data. It should therefore be interpreted as an indication not of what will happen, but of what would happen if the average net migration rate over the last two years prevailed for the rest of the decade.
What’s clear, once again, is that recent net migration is historically unprecedented. While the 2010s saw a city the size of Swansea added to the population each year, the last two years have seen a city the size of Sheffield added to the population each year. And in just the last year, a city the size of Glasgow has been added.
Now, there are reasons why the last two years’ figures are particularly high: there was a post-pandemic rebound, and the UK resettled large numbers of people from Hong Kong and Ukraine (which may not happen again in the near future).
However, these two factors can only explain about half the difference between the last two bars on the chart above. Compared to 2019, the number of non-EU migrants entering the UK for work has increased by 136,000, while the number of non-EU migrants leaving in this category has increased by only 6,000. And a similar pattern holds for non-EU students.
This suggests that when 2023’s figure comes in, it’s likely to be lower than 606,000 — though still higher than the pre-pandemic norm of 200–300,000. So unless there’s a drastic shift in policy, very high net migration is going to continue.
